Bitcoin Risks $72,500 Slide as $82,000 Resistance Caps Recovery
BTC when published $80,053Now $80,617 ▲ +0.70% since it was published
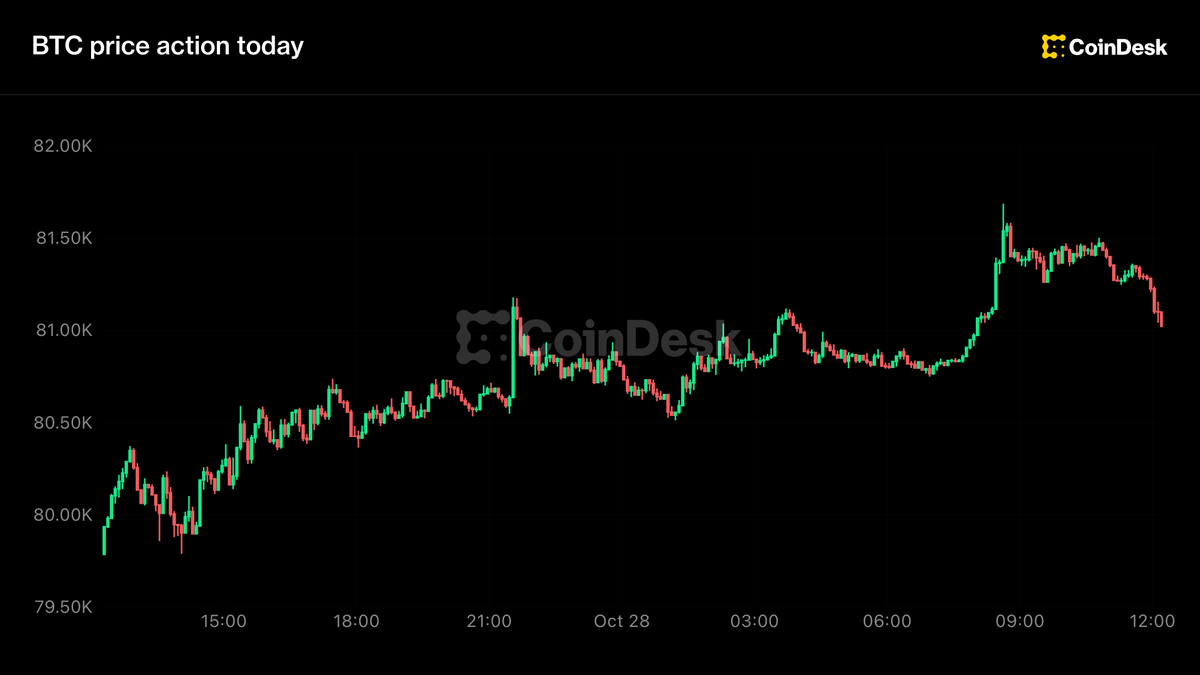
Bitcoin traded at $79,757.25 as analyst Ali Charts identified $72,500 as a potential buying zone following a chart breakdown. CoinGecko data showed Bitcoin fell 0.74% over 24 hours and 3.22% across seven days. Its 24-hour trading volume reached $18,307,119,776, while liquidation heatmaps showed concentrated exposure above and below the market. Ali Charts said Bitcoin could continue correcting while $82,000 holds as resistance on the four-hour chart. However, That Martini Guy flagged potential short liquidations above $81,000, leaving room for an upside squeeze. In his X post, Ali Charts identified an apparent breakdown below a rising parallel channel. This pattern tracks price between two upward-sloping boundaries, outlining the market’s previous direction. A break below the lower boundary suggests that the earlier upward structure has weakened.
First reported by Blockonomi. This page is a short excerpt; the full text is theirs.