Bitcoin Bull Signals are Flashing Everywhere, Analysts Claim

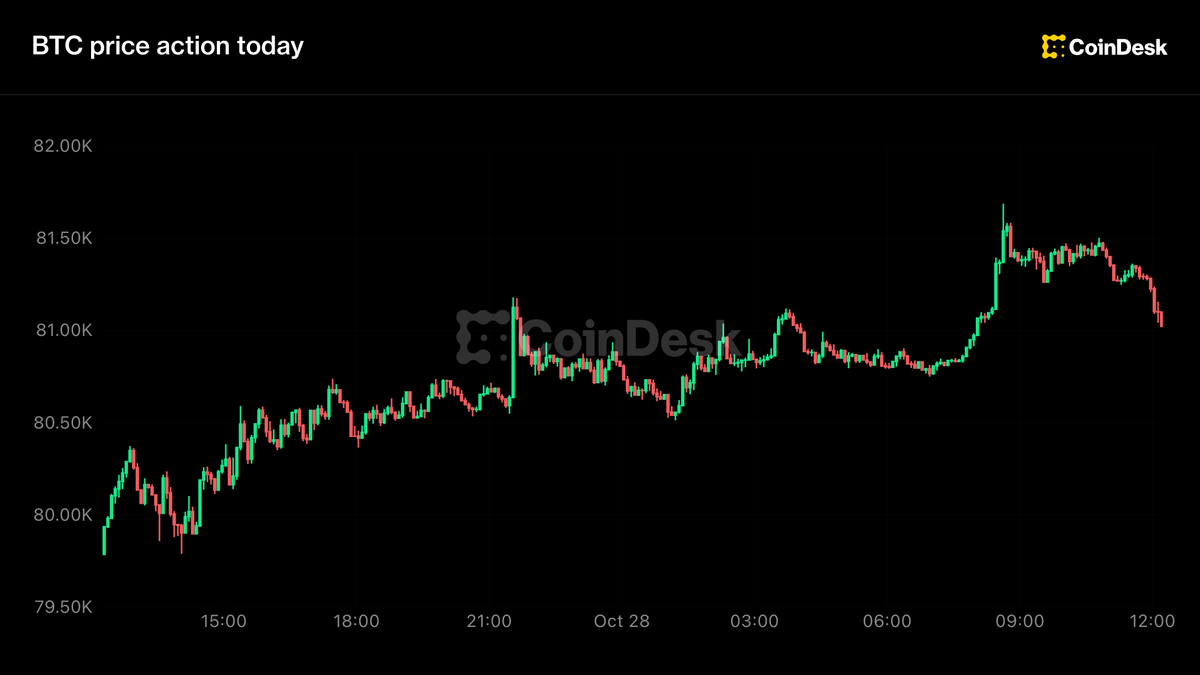
BTC when published $81,605Now $80,617 ▼ −1.21% since it was published
Bitcoin momentum turned positive on two widely watched indicators this week, ending a bearish stretch of roughly 10 months. PlanB, creator of the stock-to-flow model, shared the flip and questioned whether reading it could be that simple. His doubt has a basis. BTC trades near $81,679, down 1.7% over 24 hours and below the $83,094 level shown on his chart. Do Bitcoin Bull Signals Mark a New Cycle? PlanB shared a chart from analytics platform Block Horizon tracking momentum in Bitcoin’s Market Value to Realized Value (MVRV) ratio. MVRV compares market capitalization with the aggregate cost basis of all coins. Historically, green readings have lined up with bull markets and red readings with bear phases.
First reported by BeInCrypto. This page is a short excerpt; the full text is theirs.